
Assumptions you can defend
Every scenario is scoped to a location or an organisation and carries its own growth rate, office attendance, m2 per FTE, time horizon and cost per m2. Change one assumption and the whole projection moves with it.
Build space scenarios from your own headcount, hybrid attendance and floor area, then see projected demand against real capacity per period. Stop signing leases on a spreadsheet guess.
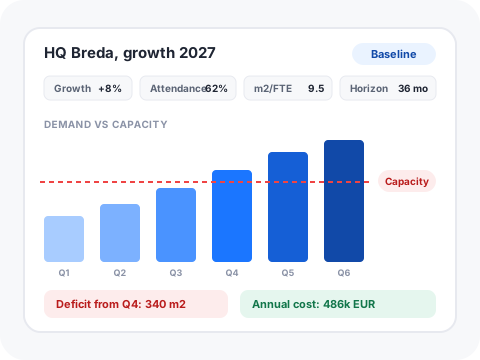
Every scenario is scoped to a location or an organisation and carries its own growth rate, office attendance, m2 per FTE, time horizon and cost per m2. Change one assumption and the whole projection moves with it.
Instead of typing a number you hope is right, pull the starting point straight from your own headcount, attendance history and registered floor area, then adjust from there. One click resets any line back to the data-driven value.
For a real fit-out study, switch from a single m2 per FTE ratio to m2 per workplace type, so desks, meeting rooms and support space are each counted properly.
Mark a scenario as the baseline, duplicate it for every what-if, then compare two side by side with the variance per period. Export any of them to Excel for the business case.
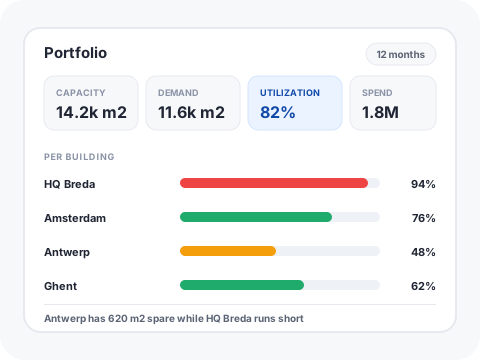
Total capacity, current demand, utilisation and annual spend across every building in one view, so you can see where the spare space already sits before you rent more.
Each scenario is backtested against what actually happened, so your next projection is judged on a track record instead of optimism.
A per floor view of desk usage over the window: how often each desk is used, which team sits there most and who the most frequent occupant is.
See which teams actually share a floor on the same days. Useful when you are deciding who to move next to whom, and when a neighbourhood is not working.
From Gfacility itself. Headcount comes from your users and organisations, attendance from declared office days and presence actuals, and floor area from the m2 registered on your locations. No separate import and no extra hardware.
No. Sensor and badge data make the picture sharper if you already have it, but the forecast runs on declared office days, desk bookings and registered floor area on their own.
Yes. A scenario is scoped to a location or an organisation, and the portfolio view rolls every scenario up into one capacity, demand, utilisation and spend picture.
It replaces the forecasting and business-case part: assumptions, projections, capacity gaps and cost. Floor plans and desk level detail live in floor maps and desk booking, which the same platform already covers.
Book a discovery call and we will model your own buildings and attendance during the session.
Schedule discovery call